Page experience metrics have a conversion story that most SEO teams undervalue.
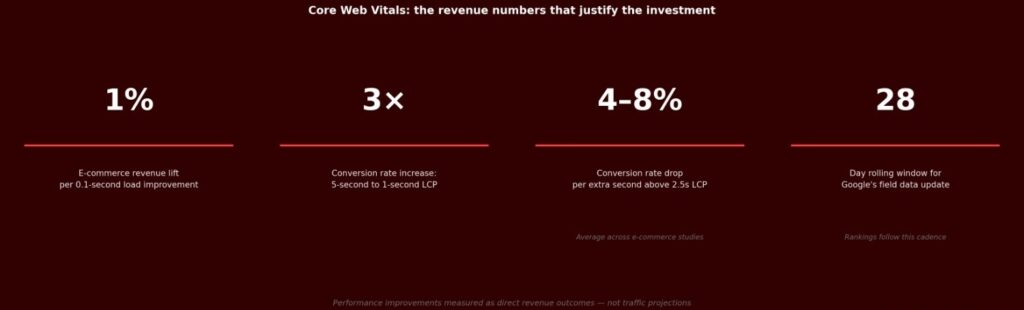
A 0.1-second improvement in load time has been documented to lift e-commerce revenue by approximately 1 percent. A site moving from 5-second to 1-second LCP typically sees conversion rates triple.
These are not traffic projections. They are revenue outcomes from performance improvements that Core Web Vitals are specifically designed to measure.
Google introduced Core Web Vitals as ranking signals in 2020, formalized them as page experience criteria, and has been tightening both the measurement methodology and the threshold expectations since. In 2025, the three metrics, LCP, INP, and CLS, are assessed from real user data collected through the Chrome User Experience Report rather than from lab simulations.
That distinction matters: your PageSpeed Insights score and your actual field performance can differ significantly, and Google ranks based on field data.
This piece explains what each metric measures, common failure sources, how to diagnose and fix them, and how Core Web Vitals influence broader business outcomes.
The Three Metrics: What They Actually Measure
Each Core Web Vital isolates a specific dimension of user experience. Understanding the mechanism behind each one makes the remediation decisions considerably more logical.
| Metric | What It Measures | Good Threshold | Primary Ranking Lever |
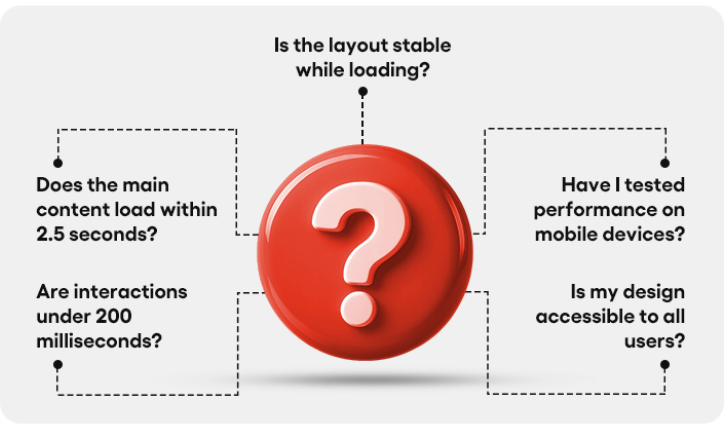
| LCP (Largest Contentful Paint) | Time for the main above-fold content element to render | Under 2.5 seconds | Image optimization, server response time, render-blocking resources |
| INP (Interaction to Next Paint) | Latency between any user interaction and the next visual response | Under 200 milliseconds | JavaScript execution time, main thread blocking, third-party script load |
| CLS (Cumulative Layout Shift) | Visual instability as elements move unexpectedly during load | Below 0.1 | Image dimension attributes, ad slot reservations, font-swap behaviour |
LCP: The Loading Experience
Largest Contentful Paint measures how long it takes for the largest visible element in the viewport to render completely. In practice, this is almost always a hero image, a large heading block, or a video thumbnail. LCP is the metric that most directly reflects the user’s perception of whether the page is loading.
The critical nuance is that LCP is measured from the user’s perspective on their actual device and network, not from your development environment. A hero image that loads in 1.2 seconds on a fiber connection in your office loads in 3.8 seconds for a mobile user on 4G in a low-signal area.
Google’s field data captures that distribution. Passing LCP means performing well for the majority of your real users, not just the best-case scenario.
INP: The Interaction Experience
Interaction to Next Paint replaced First Input Delay as a Core Web Vital in March 2024. The change matters because FID only measured the delay before the browser began processing the first interaction. INP measures the full latency of every interaction throughout the page session: the time between a user clicking, tapping, or pressing a key and the next visual update.
A page with excellent LCP can still fail INP if the JavaScript powering its interactive elements is slow to execute. This is the pattern behind sites that load quickly but feel sluggish to use.
Filter panels that take 400 milliseconds to respond, accordion menus that stutter, form fields with input lag. Users experience these as the site being unresponsive, and INP captures that experience as a rankable signal.
CLS: The Visual Stability Experience
Cumulative Layout Shift measures unexpected movement of content after the initial render. It is calculated as the total impact of all layout shifts that occur without direct user interaction, weighted by the distance elements move.
The practical manifestation is content that jumps when images load, text that reflows when fonts swap, or buttons that shift position when ads render late.
CLS failures are the most reliably fixable of the three metrics because they almost always trace back to a small number of specific implementation decisions: missing image dimensions, unreserved ad slots, and web font behaviour.
The remediation is straightforward once the sources are identified.
The Business Case: Why These Metrics Map to Revenue
The commercial argument for Core Web Vitals investment is not primarily about ranking. It is about the conversion rate consequences of poor performance, which are measurable independently of any SEO benefit.
Conversion rate studies across e-commerce sites consistently show that each additional second of LCP above the 2.5-second threshold reduces conversion rates by 4 to 8 percent on average. For a site generating significant organic revenue, that is a quantifiable cost per second of delay. The remediation of a 4-second LCP to a 2-second LCP is not a technical exercise. It is a revenue recovery calculation.
The conversion impact of INP failures is less well-documented than LCP but arguably more commercially significant for complex pages.
A product filter that takes 600 milliseconds to respond does not just feel bad. It interrupts the buyer journey at the point of active consideration. Users who encounter repeated interaction delays abandon at higher rates than users who encounter slow initial loads.
The difference is that slow loads are visible and attributable. Interaction latency is often invisible in standard analytics.
CLS failures tend to produce distinct revenue consequences in e-commerce contexts. When layout shifts occur near CTAs, add-to-cart buttons, or payment fields, they create accidental clicks on the wrong elements, which either produce error states or trigger user frustration at the exact moment of conversion intent. Reducing CLS on transactional pages eliminates a category of conversion friction that has nothing to do with copy, offer, or design quality.
Where Failures Come From: The Diagnostic Framework
Most Core Web Vitals failures trace back to a small set of recurring causes. The table below maps the common failure patterns to the diagnostic tools that surface them and the specific fixes that resolve them.
| Metric Affected | Failure Pattern | Diagnostic Tool | Fix |
| LCP | Hero image not preloaded or served at desktop resolution on mobile | PageSpeed Insights, Lighthouse LCP element report | Preload hero resource in document head; serve mobile-specific image with srcset; convert to WebP |
| LCP | Slow server response time (TTFB over 600ms) | Chrome DevTools waterfall, WebPageTest | Upgrade hosting tier, implement server-side caching, use CDN for static assets |
| LCP | Render-blocking CSS or JavaScript in document head | Lighthouse render-blocking resources audit | Defer non-critical scripts; inline critical CSS; remove unused CSS |
| INP | Heavy JavaScript executing on main thread during interactions | Chrome DevTools Performance panel, CrUX INP data | Audit and reduce third-party scripts; break up long tasks; defer non-essential event handlers |
| INP | Large DOM size increasing interaction processing time | Lighthouse DOM size audit | Reduce DOM node count; virtualize long lists; lazy load off-screen content |
| CLS | Images without explicit width and height attributes | Lighthouse CLS audit, Layout Instability API | Add explicit width and height to all img elements; use aspect-ratio CSS |
| CLS | Dynamically injected content above existing content | Chrome DevTools Layout Shift Regions | Reserve space for ads, banners, and dynamic content with min-height containers |
| CLS | Web font swap causing text reflow | Font load timing in Lighthouse | Use font-display: optional; host fonts locally to eliminate third-party request latency |
The diagnostic workflow that consistently produces the fastest results is: Start with Google Search Console’s Core Web Vitals report to identify which pages have field data failures, then run those specific pages through PageSpeed Insights to get the lab-based diagnosis, then use Chrome DevTools for deeper investigation on the identified issues.
Lab tools identify the problem; field data confirms the impact.
One important caveat: PageSpeed Insights and Lighthouse scores measure simulated performance under controlled conditions. They are useful diagnostic tools, but they are not what Google ranks.
A page can score 90 in Lighthouse and still fail Core Web Vitals in real-world conditions.
Lab tests run in controlled environments, but actual users browse on slower devices and inconsistent networks. High traffic can also strain servers and worsen performance. These factors often create results that differ from simulations.
Always compare Lighthouse scores with real user data in Search Console.
The INP Problem: Why It Deserves Separate Attention
INP is the Core Web Vital that most sites are least prepared for, and the one most likely to have ranking consequences in 2025 if left unaddressed. The reason is structural:
INP failures are almost always caused by JavaScript, and modern web stacks are JavaScript-heavy in ways that were acceptable before interaction latency became a ranking signal.
The mechanism is the browser’s main thread. When JavaScript is executing on the main thread, the browser cannot respond to user interactions.
A long-running script that takes 300 milliseconds to complete will delay the visual response to any user interaction that occurs during that execution window by at least 300 milliseconds. If multiple long tasks are chained, a single click can produce an INP failure even if the individual interactions feel only slightly sluggish.
Run a Lighthouse audit to identify long tasks affecting INP. Check the JavaScript coverage report in Chrome DevTools for unused code. Excess scripts often slow the main thread. Audit third-party scripts individually to measure their blocking impact.
Marketing-added scripts are frequently the largest contributors. Chat widgets, A/B testing tools, session recording tools, and ad management platforms all introduce JavaScript load that can push INP above the 200-millisecond threshold.
The fix is not always script removal.
Often, the highest-return intervention is scheduling: moving non-critical JavaScript to execute during idle periods rather than blocking the main thread during page initialization.
The scheduler.postTask API and requestIdleCallback provide the browser hooks to implement this. For heavy third-party scripts, loading them after the initial page interaction is complete, rather than on page load, can move INP scores from failing to passing without eliminating any functionality.
A Representative Performance Recovery
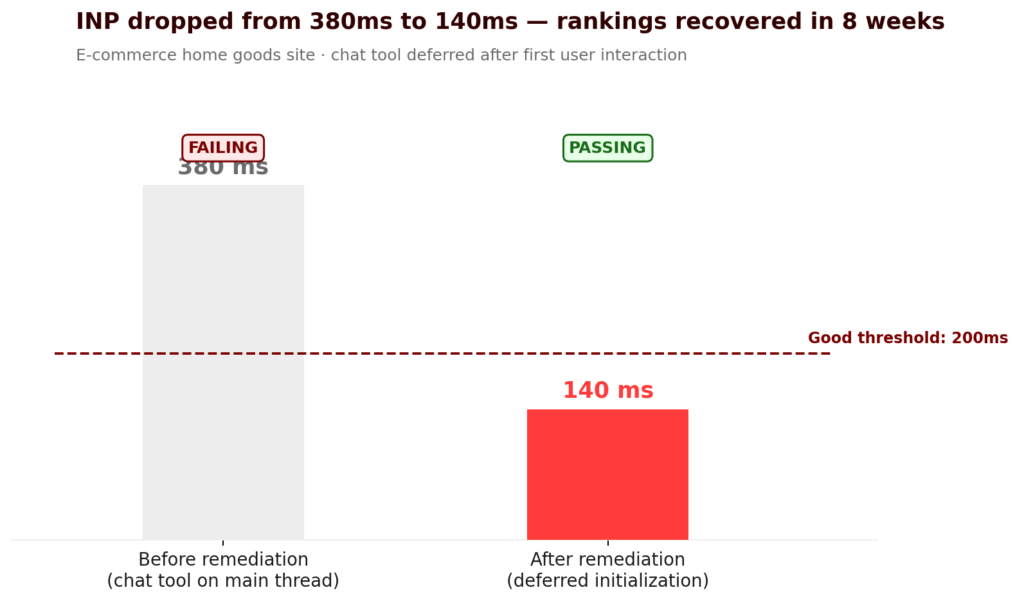
An e-commerce site in a competitive home goods category had held consistent first-page rankings for its target keywords for over a year.
A site-wide template update in late 2024 introduced three new third-party scripts, including a chat tool, a personalization engine, and an updated tag management configuration.
Core Web Vitals field data in Search Console began showing INP failures across the product page template two weeks after the update.
Rankings for the affected page template declined gradually over the following six weeks. The correlation was not immediately obvious to the team because the ranking changes were gradual rather than sudden, and the desktop performance scores in PageSpeed Insights remained high.
The INP failures were traced to the chat tool loading a heavy initialization script on the main thread during page load. Deferring that initialization until after the first user interaction reduced INP from an average of 380 milliseconds to 140 milliseconds across the product page template. The personalization engine was configured to load asynchronously rather than synchronously.
Rankings recovered to pre-update levels over approximately eight weeks following remediation.
The lag between fix and recovery is typical: Google’s field data updates on a 28-day rolling window, so ranking changes following Core Web Vitals improvements follow that cadence rather than appearing immediately.
Core Web Vitals and AI Overview Eligibility
The relationship between Core Web Vitals and AI Overview citations is not directly documented by Google, but the indirect connection is well-supported. Google’s systems evaluate page quality across multiple dimensions before extracting content for AI-generated summaries. Technical performance is a component of that quality evaluation.
The more direct connection is through user engagement signals.
Pages that load slowly, respond sluggishly to interaction, or shift layout unexpectedly generate behavioural signals, higher bounce rates, lower scroll depth, and shorter session duration that correlate with lower quality evaluations.
AI systems trained on quality signals incorporate these behavioural indicators into their assessment of which content to surface.
Practically, the sites appearing most consistently in AI Overviews for competitive queries tend to share two characteristics: strong topical authority in their content and strong technical performance. The performance component is not sufficient on its own, but it removes a disqualifying signal that prevents otherwise authoritative content from being selected.
Building Core Web Vitals Into Your Development Process
The most common failure mode for Core Web Vitals programs is treating them as a one-time remediation exercise rather than an ongoing development consideration.
Sites that fix their scores in Q1 and then regress by Q3 typically do so because new features, new third-party integrations, or template changes are shipped without a Core Web Vitals impact assessment.
The sustainable model is an integration into the development workflow. This means running Lighthouse audits as part of the pre-deployment review process for any significant template change, monitoring Search Console’s Core Web Vitals report on a monthly cadence rather than reactively, and establishing a clear ownership for Core Web Vitals performance within the engineering or growth team.
For sites on CMS platforms where direct code control is limited, the most impactful ongoing maintenance practice is auditing the third-party script inventory quarterly.
Marketing tools accumulate over time. Scripts added for a campaign that ended six months ago often remain active and consume performance budget that the current team does not know exists.
A regular script audit combined with monitoring through Search Console’s field data creates the feedback loop needed to sustain performance over time.
If you want to know specifically where your site’s Core Web Vitals field data is failing, and what the ranking and conversion impact of each failure is, a structured performance audit will surface both. Request a Core Web Vitals audit with revenue impact assessment.
The Emerging Factors Alongside Core Web Vitals
Google’s page experience signals extend beyond the three Core Web Vitals, and the direction of travel in 2025 reflects a broader definition of what constitutes a quality experience.
Cross-Browser and Cross-Device Performance
Google’s ranking evaluation increasingly incorporates real user data from across browser environments, not exclusively Chrome.
A site that performs well in Chrome but degrades in Safari or Firefox, due to browser-specific rendering differences or API incompatibilities, creates a quality inconsistency that is increasingly visible in field data.
Testing performance across major browsers is no longer optional for sites with meaningful Safari traffic, which means any site with significant iOS usage.
Accessibility as a Page Quality Signal
Accessibility compliance and page experience quality are increasingly correlated in Google’s evaluation signals.
Pages that pass Core Web Vitals thresholds but fail basic accessibility criteria, insufficient colour contrast, missing ARIA labels, and non-functional keyboard navigation show lower engagement quality signals from the users they disadvantage.
Beyond the SEO signal, accessibility improvements tend to improve overall user experience metrics that feed back into ranking quality assessments.
Ad Density and Interstitial Behaviour
Google’s page experience evaluation has long included assessments of intrusive interstitials and excessive ad density as negative signals.
In 2025, this is operationalized through both manual review and algorithmic scoring that treats high ad-to-content ratios and content-blocking overlays as experience degradation signals.
The practical standard is that advertising and pop-up overlays should not meaningfully reduce the usable content area of a page or require user action to access primary content.
Get a Clear Diagnosis of Where Your Core Web Vitals Are Costing You
Most sites have Core Web Vitals failures that are invisible in their standard analytics dashboards but visible in Search Console field data and measurable in conversion rate differentials. A focused performance audit identifies the specific failures affecting your rankings, quantifies the conversion impact of each, and prioritizes the fixes by return on investment. If you want that analysis before a competitor closes the gap, the right starting point is a conversation about what your current field data actually shows.
→ Request a Core Web Vitals performance audit