
Most performance marketers are tracking the right numbers and drawing the wrong conclusions from them. They report CTR to the CMO, the CMO reports ROAS to the CFO, and somewhere in that chain, the actual business question, which is whether marketing is generating profitable, scalable growth, gets lost.
That is the problem this article is designed to solve.
These ten metrics are not a checklist. They are a diagnostic system.
Used together, they tell you where your funnel is healthy, where it is leaking, and where you are spending money to acquire customers you cannot afford to keep.
Why Metric Selection Is a Strategic Decision
Before getting into individual metrics, a clarification is worth making: Not all metrics deserve equal weight at every stage of your business.
A brand in early acquisition mode should be obsessing over CAC and conversion rate. A brand with strong retention economics should be optimizing toward LTV and CPA by customer segment. Treating all ten metrics as equally urgent at all times is a fast path to analysis paralysis.
The goal is to build a metrics architecture where the numbers you report upstream tell a coherent story about business performance, not just campaign performance.

With that framing in place, here are the ten metrics worth building that architecture around.
1. Click-Through Rate (CTR)
CTR is the percentage of people who saw your ad or content and chose to click. Total clicks divided by total impressions, expressed as a percentage.

The number itself is less useful than what it tells you about relevance alignment. A strong CTR means your creative, copy, and targeting are pulling in the right direction. A poor CTR usually means one of three things:
- the audience is wrong,
- the offer is not resonating, or
- the creative is not stopping the scroll.
On Google Search, average CTRs cluster around 3% across industries. On display, they are a fraction of that. Neither number is a target.
Your actual benchmark should be your own historical performance by placement and audience segment, not an industry average built from aggregated data across contexts wildly different from yours.
Where CTR misleads: A high CTR on a low-intent audience costs you money.
If you optimize for CTR without watching what happens downstream, you can build a beautiful traffic machine that converts at 0.5% and burns budget faster than it generates pipeline. Always read CTR alongside the conversion rate.

2. Cost Per Click (CPC)
CPC tells you what you paid for each click. It is a bid-driven metric shaped by competition, Quality Score on Google, relevance score on Meta, and auction dynamics you only partially control.

Why it matters: CPC is your unit cost of attention.
If your CPC is rising quarter over quarter on the same audiences, that is a signal worth investigating. Either competition in your category has increased, your creativity is fatiguing, or your relevance scores have declined because your landing experience has drifted from your ad message.

The strategic mistake most teams make is treating CPC as a lever to minimize in isolation. A higher CPC that delivers a lower-cost acquisition is always preferable to a low CPC that generates cheap, unqualified traffic. CPC optimization that ignores downstream conversion economics is local optimization at the expense of global performance.
Practical use: Track CPC by campaign type, placement, and audience segment. Watch the trend line, not just the absolute number. Spikes in CPC often precede drops in conversion rate if the audience pool is being diluted.
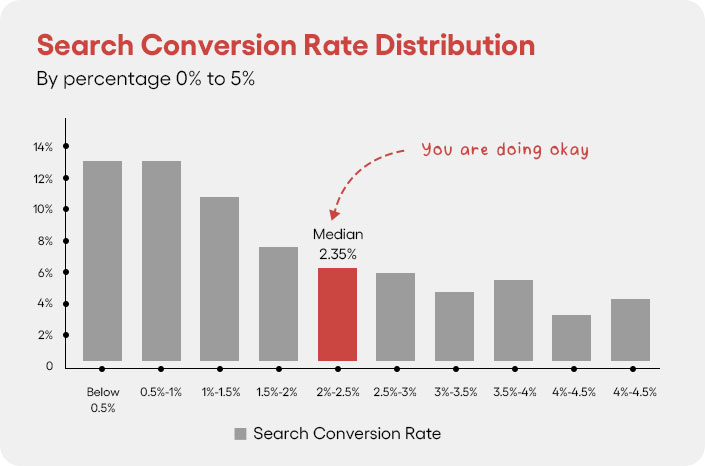
3. Conversion Rate (CVR)
Conversion rate is the percentage of visitors who completed the action your campaign was designed to drive, whether that is a purchase, a form fill, a trial sign-up, or a call booking. Conversions divided by total visitors, multiplied by 100.

The industry average for e-commerce landing pages hovers around 2-3%. Most B2B lead gen pages run lower.
Neither figure should anchor your expectations, because the conversion rate is acutely sensitive to
- offer quality,
- page experience,
- traffic quality, and
- device mix in ways that make cross-brand benchmarks nearly meaningless.
What CVR actually diagnoses: It is a measure of funnel integrity at the moment of decision.
When CVR drops, the cause is usually one of a short list:
- The traffic source has changed in quality,
- The offer has lost competitiveness,
- The page experience has a friction problem, or
- There is a mismatch between the promise in the ad and the reality on the landing page.
A CVR problem is never solved by increasing media spend. That just amplifies the leak. Fix the conversion environment first, then scale.
4. Customer Acquisition Cost (CAC)
CAC is the total cost required to acquire a single new customer. This means all marketing and sales spend, not just media budget, is divided by the number of new customers acquired in the same period.

The reason CAC is one of the most consequential metrics in performance marketing, particularly for subscription and SaaS businesses, is that it sets the ceiling on how aggressive you can be in acquisition. If you do not know your CAC, you are essentially bidding blind in every auction.
The number that makes CAC actionable is the ratio between CAC and LTV. A CAC of 2,000 rupees is irrelevant without knowing whether the average customer generates 4,000 rupees or 40,000 rupees over their lifetime. That ratio determines how much you can afford to spend to win a customer and still have a viable business.
Common mistake: Teams calculate CAC using only media spend and exclude agency fees, tools, content production, and sales team time. The resulting number is artificially low and leads to bidding strategies that erode margin invisibly.
Advanced use: Break CAC down by channel, campaign, and audience segment. Your blended CAC hides the fact that some channels are delivering customers at 3x the acquisition cost of others, with the same or worse LTV profile.
5. Return on Ad Spend (ROAS)
ROAS is revenue generated divided by ad spend. A ROAS of 4 means every rupee spent on advertising returned four rupees in revenue.

It is the most commonly cited performance metric in board decks, and also one of the most frequently misused.
Here is the issue: ROAS is a revenue measure, not a profit measure. A campaign with a 5x ROAS on a 10% margin product may be destroying value at scale. The same ROAS on a 60% margin product is genuinely excellent. Without knowing your contribution margin, ROAS is a signal that requires context to interpret.

The more useful metric for most businesses is MER (Marketing Efficiency Ratio) or target ROAS calculated backward from your desired contribution margin. That gives you a floor below which you should not run campaigns, regardless of what your CTR or traffic volume looks like.
ROAS also has an attribution problem. Last-click ROAS on Meta overstates the platform’s contribution in multi-touch journeys. Brands that optimize exclusively toward platform-reported ROAS often discover during incrementality testing that a meaningful portion of attributed revenue would have occurred organically.
6. Customer Lifetime Value (LTV)
LTV is the total revenue, or more usefully, total gross profit, a customer is expected to generate across their entire relationship with your business. Average order value multiplied by purchase frequency multiplied by customer lifespan gets you a basic estimate.

LTV is the metric that determines whether your current acquisition economics are sustainable.
It is also the metric most frequently underinvested in by performance teams, who are typically incentivized on short-term acquisition efficiency rather than long-term customer economics.
The practical implication: A brand that knows its LTV by acquisition channel and customer cohort can make fundamentally different bidding decisions than one operating on blended averages. If customers acquired through branded search have a 40% higher LTV than those from broad prospecting campaigns, that changes your budget allocation logic materially.

LTV is also not static. It improves with retention investment, product expansion, and loyalty infrastructure. Brands that treat LTV as a fixed input rather than a variable they can move will always be constrained in how aggressively they can compete for acquisition.
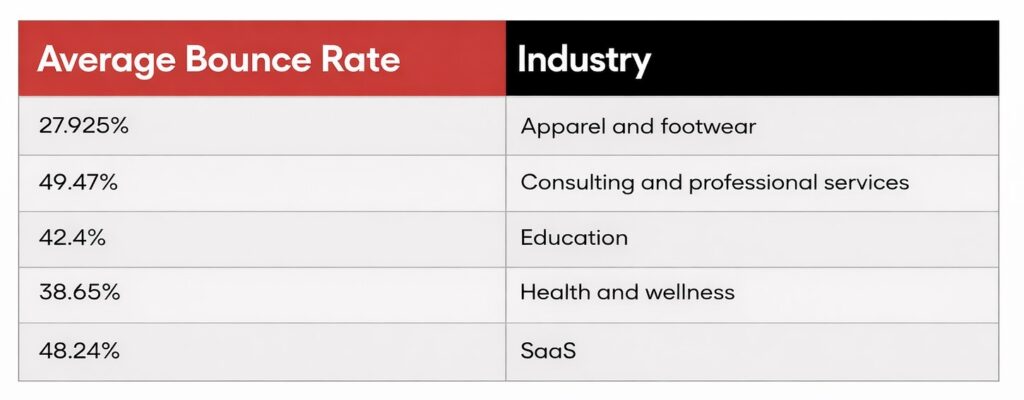
7. Bounce Rate
Bounce rate is the percentage of sessions where a user landed on a page and left without any further interaction. One page view, then gone.

The benchmark conversation around bounce rate is often misleading. A 60% bounce rate on a blog post that exists to inform, where users read the content and return to search having gotten their answer, is not inherently a problem. A 60% bounce rate on a paid traffic landing page is a significant commercial problem.
Context determines what the number means. What you actually want to know from the bounce rate is whether users who arrived with purchase intent are finding a reason to stay and continue. That requires segmenting bounce rate by traffic source, campaign, device, and page type before drawing any conclusions.
When a high bounce rate is a real problem, the causes are usually one of four things:
- slow page load time (the single most common culprit),
- a broken promise between the ad creative and the landing page,
- poor mobile experience, or
- irrelevant traffic.
Each has a different fix, and conflating them leads to wasted optimization effort.
8. Cost Per Acquisition (CPA)
CPA is the cost of acquiring a specific conversion action. Where CAC measures the cost of a customer, CPA can be scoped to any defined conversion event: a lead, a trial activation, a subscription start, or a completed purchase.

The distinction from CAC is important. CPA gives you granular optimization data at the campaign and ad set level. CAC is the business-level output. You optimize CPA at the tactical level to drive CAC improvement at the business level.
Average CPA on Google Search across industries runs around $48-60 USD. That figure is largely useless for any specific business, but it illustrates that paid acquisition is expensive when you are not controlling funnel quality from click to conversion.

The most effective CPA reduction levers are:
- better audience qualification upstream,
- tighter creative-to-landing-page alignment, and
- higher conversion rates on the landing experience itself.
Bid strategy changes alone rarely move CPA meaningfully without addressing one of these underlying factors.
A target CPA bid strategy in Google Ads will pace toward your stated goal, but it cannot compensate for a 0.8% conversion rate on a page that should be converting at 3%.
9. Engagement Rate
Engagement rate measures the proportion of your audience that actively interacts with your content: likes, comments, shares, saves, and click behavior, depending on the platform.

For paid performance campaigns, engagement rate is a directional signal, not a primary optimization metric. High engagement with low conversion suggests your creative is entertaining but not purchase-motivating.
That is useful information for creative strategy, but it should not distract from conversion-focused optimization.
Where engagement rate earns its place in the reporting stack is in brand and content campaigns, where conversion is not the immediate goal but audience quality and content resonance are. In those contexts, engagement rate is one of the few available proxies for measuring whether the content is landing.
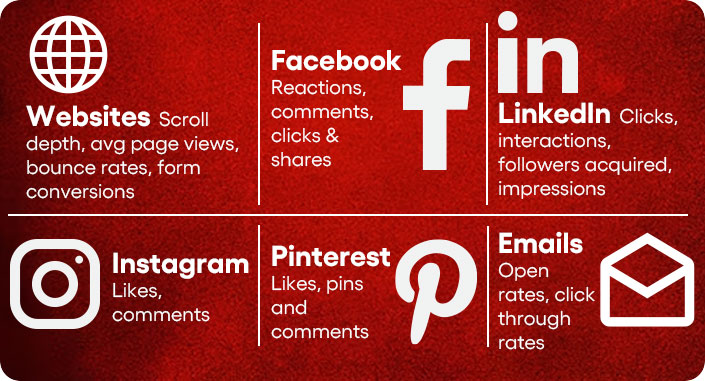
Platform definitions vary. Instagram measures engagement differently than LinkedIn, which measures it differently from TikTok. Cross-platform engagement comparisons require normalizing for platform behavior norms, not just raw percentages.
10. Search Impression Share
Impression share is the percentage of eligible impressions your ads actually received, compared to the total available. If your ads were eligible to appear 10,000 times and showed 6,000 times, your impression share is 60%.

It matters because impression share loss has two distinct causes: budget and quality/rank. Understanding what is constraining you determines the correct response.
- Budget-constrained impression share loss means you are leaving demand coverage on the table and could capture more volume by spending more.
- Rank-based impression share loss means your quality score, bid, or relevance needs to improve before spending more makes sense.
For brands in competitive categories, impression share is a useful competitive signal. If your share declines without any change in your own bidding behavior, a competitor has likely increased their aggression in the auction. That is an early warning worth acting on.
Impression share is most valuable as a planning metric for branded search campaigns, where the goal is usually to capture as close to 100% of your own branded demand as economically possible.
Building the Metrics Stack That Actually Serves the Business
These ten metrics form a complete diagnostic layer when read together.
- CTR and CPC tell you about the efficiency of your attention acquisition.
- CVR, CPA, and CAC tell you about the efficiency of your conversion infrastructure.
- LTV and ROAS tell you about the revenue and return dynamics of your customer relationships.
- Bounce rate and engagement rate give you leading indicators of experience quality.
- Impression share tells you about your competitive coverage.
The error most performance teams make is running a reporting cadence that treats these metrics in isolation. A weekly report that shows ROAS improved while not noting that CVR declined and bounce rate spiked is missing the story. The metrics only tell you something useful when you read them as a connected system.
The second common error is optimizing toward short-term metric improvements that erode long-term business health. Cutting CAC by targeting lower-intent, easier-to-convert audiences often reduces average LTV in the same motion. The acquisition math improves while the retention economics deteriorate.
Building a metrics architecture that captures both dimensions and that ties performance marketing inputs to business outputs like contribution margin, payback period, and net revenue retention is what separates performance teams that operate as a revenue function from those that operate as a traffic function.
Want to Learn How Performance Marketing Can Help Your Business?
If you want a second opinion on how your current metrics setup maps to your actual business goals, or where the gaps between what you are measuring and what you should be optimizing for are largest, that is a conversation worth having.