
Most marketing teams use Google Analytics to confirm what they already believe.
- Traffic is up, so the campaign worked.
- Bounce rate dropped, so the redesign helped.
- Sessions are growing, so organic is healthy.
The problem with that approach is that confirmatory analysis misses the signals that would actually change how you operate.
The underused value in GA4 is not hidden in obscure reports. It is in the gap between what the data says and what most teams bother to ask of it.
This piece covers the analytical habits and configurations that separate teams making revenue decisions from data versus teams generating dashboards for quarterly reviews.
Google Analytics Insights That Demand a Closer Look
1. The Foundational Problem: Measuring Activity Instead of Outcomes
Before getting into specific reports and features, the framing matters.
Most GA4 setups are configured to measure what is easy to measure:
- page views,
- sessions,
- users, and
- traffic source.
These are activity metrics. They tell you what happened on your site. They do not, by themselves, tell you whether any of it contributed to pipeline, revenue, or retention.
The configuration work required to make GA4 a genuine business intelligence tool is not technically complex. But it requires someone to make deliberate decisions about what outcomes actually matter for your business and then build the measurement infrastructure to track them.
That work gets skipped often because it requires cross-functional alignment between marketing, product, and engineering.
The consequence: Teams spend hours analyzing data that cannot answer the questions leadership is actually asking.
2. Conversion Tracking: The Configuration Most Sites Get Wrong
If your GA4 account is tracking “goal completions” as a single aggregate event, you are missing the analytical resolution needed to make good optimization decisions.
GA4’s conversion tracking model centers on key events, which are simply events you have marked as conversions. The value of this system is that it allows you to distinguish between different types of valuable actions:
- a newsletter signup,
- a product demo request,
- an e-commerce purchase,
- a phone call,
- a document download.
Each of these has different commercial significance, and treating them as undifferentiated “conversions” obscures the analysis.
The better configuration: Define your key events in a hierarchy that reflects your actual funnel.
For an e-commerce store, that might be:
- add-to-cart,
- initiation of checkout,
- purchase, and
- post-purchase review submission.
For a B2B SaaS company:
- free trial signup,
- feature activation, and
- paid conversion.
Each event should have a monetary value assigned where possible, which enables revenue attribution analysis across channels and content types.
What most setups miss: Micro-conversions that signal intent before the primary conversion event. A user who downloads a sizing guide, adds a product to a wishlist, or engages with a configurator tool is showing purchase signals that will never appear in a standard “purchase” conversion event. Tracking these micro-conversions allows you to identify pages and content that are commercially productive even when they do not directly close a transaction.
The practical mistake:
Marking too many events as key conversions, which inflates conversion counts and makes comparative analysis meaningless. Be deliberate about what qualifies as a key event. If everything is a conversion, nothing is.
3. User Journey Analysis: Where Revenue Is Actually Lost
The question most e-commerce and lead generation teams need to answer is not “how much traffic are we getting?” It is “where in the buying process are we losing people, and why?”
GA4’s path exploration report (formerly the User Flow report in Universal Analytics) lets you map the sequence of pages or events a user moves through before converting or exiting.
The commercially valuable version of this analysis is not the default view of all users. It is a segmented view that compares users who converted against users who did not.
The pattern this analysis typically surfaces: users who convert follow a relatively consistent path through a small number of high-value pages.
Users who do not convert often get stuck at a specific junction, frequently
- a product page,
- a pricing page, or
- a checkout step, and exit without completing the action.
Identifying those exit points is straightforward. Understanding why users exit there requires a combination of the quantitative data in GA4 and qualitative insight from session recording tools, user surveys, or customer interviews.
GA4 tells you where the leak is. It does not tell you the cause. Teams that try to fix conversion problems based purely on analytics data without qualitative validation often optimize for the wrong variable.
An underused application:
Use the path exploration report to identify content that unexpectedly appears in converting user journeys. If a specific blog post or product comparison page consistently appears in paths that end in purchase, that page is contributing commercial value that your attribution model probably is not capturing.
It deserves investment in optimization and internal linking.
4. Hidden Conversion Killers: Device and Browser Segmentation
This is one of the most reliably useful analyses in GA4 and one of the most consistently neglected.
Open GA4’s Tech Details report and look at conversion rates segmented by device category, operating system version, and browser. In most cases, you will find meaningful variation.
Conversion rates on iOS often differ from Android. Older browser versions sometimes show dramatically higher exit rates at specific funnel steps. A specific combination of device and OS that represents 8% of your traffic might be converting at one-third the rate of your overall average.
The reason this matters commercially: If 10% of your traffic is converting at a fraction of the rate of your remaining traffic due to a rendering or functionality issue, fixing that issue is a conversion rate optimization win that requires zero additional traffic. The revenue opportunity is already in the funnel. You are just failing to capture it.
The diagnostic process: When you identify a device or browser segment with anomalous conversion behavior, the first step is to reproduce the experience on that device and browser.
Many issues are immediately obvious when you actually visit the site on the affected configuration
- a form that does not render correctly,
- a sticky navigation element that covers a CTA, and
- a payment method that is not available on certain mobile browsers.
What to watch for specifically: Exit rate spikes at checkout on specific mobile devices are often payment integration issues. High bounce rates on a specific browser version often indicate a JavaScript error that is silently breaking page functionality. These are not SEO problems or content problems. They are engineering problems with direct revenue impact.
5. Site Speed Data: What You’re Getting Wrong
GA4 provides page load time data, but interpreting it correctly requires understanding what the numbers actually represent and where their limitations are.
The Site Speed reports show average page load times across your site and for individual pages. The obvious use is identifying slow pages that need optimization. But the more valuable use is understanding load time in relation to conversion rate and revenue.
A page that loads slowly but has no commercial function, say a legal disclaimer or a press release from three years ago, is not worth optimizing for performance. A product page or checkout step that loads slowly has a directly measurable revenue impact.
The prioritization should reflect commercial importance, not just technical severity.
The metric that matters more than average load time: Core Web Vitals segmented by real user experience, specifically Largest Contentful Paint (LCP) at the 75th percentile across mobile and desktop.
GA4 incorporates Core Web Vitals data when paired with Google Search Console, and the combination of performance data with ranking data is where the most actionable insights live. A page with poor LCP scores is simultaneously delivering a bad user experience and carrying a ranking penalty. Fix it, and you improve both conversion and visibility.
Common diagnostic failure:
Teams identify slow pages and focus optimization effort on server response time or image compression while leaving render-blocking JavaScript untouched. JavaScript execution is frequently the primary load time issue on modern sites, particularly for pages that load multiple third-party scripts (chat widgets, analytics tags, heatmap tools, retargeting pixels). A tag audit often reveals significant page weight that was added incrementally with no accountability for its performance cost.
6. Filtering Out Internal and Non-Human Traffic
This is a configuration issue with real analytical consequences, and it is surprisingly common for it to be handled incorrectly or not at all.
If your team regularly visits your own site for testing, content review, or account management, their sessions appear in your analytics data. If you have significant organic traffic volume, a portion of that will be bot traffic.
Neither represents actual user behavior, and their inclusion inflates session counts, distorts engagement metrics, and creates misleading trend data.
The correction in GA4: Create a filter to exclude internal IP addresses from your reporting view. If your team works from a consistent IP range or uses a VPN with consistent exit IPs, this is a straightforward implementation.
- For fully remote teams with variable IPs, the alternative is to set a custom dimension that flags internal users, which allows you to filter them out in exploration reports.
- For bot traffic, GA4 has a default “exclude known bots and spiders” setting that handles the most common sources.
- For sites with unusual bot traffic patterns, the traffic source and geographic distribution of sessions will reveal anomalies that warrant manual investigation and custom filter rules.
Why this matters for SEO analysis specifically: If bot traffic is inflating your organic session counts, your organic conversion rate will appear lower than it actually is. This can lead to incorrect conclusions about the commercial quality of your organic traffic and misallocated optimization effort.
7. Custom Alerts: Your SEO Early Warning System
GA4 allows you to configure custom insights that trigger notifications when specific metric thresholds are crossed. This is not a complicated feature. It is also not one that most teams use effectively after initial setup.
The commercially relevant alert configurations:
Conversion rate alerts:
Notify when the key event conversion rate drops below a defined threshold for a sustained period. A 20% drop in checkout completion rate that you detect within 24 hours allows you to investigate and fix the issue before it compounds into a significant revenue loss. The same drop detected a week later has already cost you.
Traffic source anomalies:
Alert when organic traffic to high-revenue pages drops meaningfully. A ranking loss on a primary commercial keyword often shows up in traffic data before it surfaces in rank tracking tools. Early detection allows for faster response.
Segment-specific alerts:
Conversion rate drops on specific device types or in specific geographic markets are often the first signal of a technical issue or a localized problem (a payment provider outage in a specific region, for example).

The failure mode for custom alerts is setting thresholds that are either too sensitive, generating alert fatigue, or too broad, missing meaningful changes in the noise. Start with alerts for your highest-revenue pages and your most important conversion events, and calibrate thresholds based on observed normal variance before expanding coverage.
8. Content Grouping: Strategy Over Pages
Individual page performance analysis has a fundamental limitation: it tells you how a page is performing, not how a content strategy is performing.
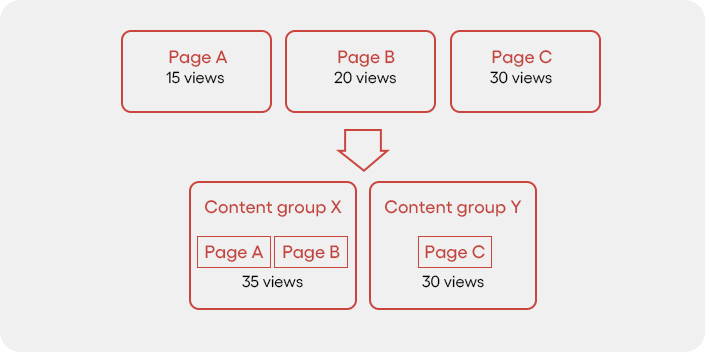
GA4’s content grouping feature allows you to assign pages to logical categories, for example, “product pages,” “category pages,” “buying guides,” “comparison content,” “blog posts,” and then analyze performance at the group level.
The strategic value is significant. You can see which content types are driving the most conversion-path traffic, where different content groups sit in the user journey, and which categories have the strongest engagement-to-conversion ratios.
For a typical e-commerce or B2B site, this analysis often reveals a meaningful asymmetry: Certain content types drive substantial traffic but contribute little to conversions, while other content types have lower traffic but appear consistently in converting user journeys. That asymmetry should inform content investment decisions.
The implementation consideration:
Content grouping requires either a consistent URL naming convention that allows regex-based grouping rules or manual assignment via a custom dimension set in your tag configuration.
- For sites with clear URL structures, implementation is quick.
- For sites with opaque URL patterns, some engineering involvement is needed.
How to actually use the data:
Once groups are configured, build an exploration report that shows each content group’s contribution to key events across a 90-day window. Cross-reference with organic traffic share to understand which groups are delivering commercial value relative to their traffic cost.
This is the kind of analysis that informs quarterly content strategy decisions.
9. E-Commerce Tracking: The Full Funnel Picture
If you run an e-commerce site and you are not using GA4’s enhanced e-commerce tracking, you are analyzing roughly half of the available data about your sales performance.
Enhanced e-commerce tracking captures the full product interaction funnel:
- impressions (how often a product appears in a listing or search result on your site),
- clicks,
- product detail page views,
- add-to-cart events,
- checkout steps, and
- purchases.
Each stage of this funnel can be analyzed individually and in sequence, which surfaces precisely where products are losing commercial momentum.
The patterns this analysis reveals that standard purchase tracking cannot:
Impression-to-click rates by product position show which products are getting views but failing to generate interest. A product that appears frequently in category listings but has a low click rate has a thumbnail, title, or price point problem, not a traffic problem.
Add-to-cart abandonment rates by product identify which specific products are generating consideration but not completing purchase. This can reflect pricing, shipping cost reveals at the cart stage, or a product detail page that is not answering the questions buyers need answered before they commit.
Checkout funnel drop-off by step is the most commercially direct analysis: at which specific step in the checkout process are you losing the most transactions? Step three of four, with high drop-off, often indicates
- a trust issue (payment security concerns),
- a friction issue (too many required fields), or
- a surprise issue (shipping costs not disclosed until late in the process).
Each of these is a fixable problem with measurable revenue impact. Enhanced e-commerce tracking makes them visible. Standard traffic analysis does not.
10. Custom Dashboards for Smarter Reporting
GA4’s default reports are designed to be broadly useful for all users, which means they are optimized for none of them in particular. For any team with specific commercial objectives, custom reports and dashboards are worth the configuration time.
The principle for designing useful dashboards:
Start with the business question, not the data. What is the decision that this dashboard should inform?
- If the answer is ” our high-intent organic pages contributing to revenue,” build a dashboard that shows organic traffic, conversion rate, and revenue for your target keyword clusters.
- If the answer is “which acquisition channels have the best LTV characteristics,” you need a dashboard that connects session source to post-purchase behavior over time.
GA4’s exploration reports provide a flexible canvas for this kind of analysis. The funnel exploration, segment overlap, and path exploration tools are the three most commercially useful for most marketing and growth teams.
A practical custom report configuration that most teams should build but do not: A landing page performance report shows, for each major landing page,
- organic traffic volume,
- engagement rate,
- key event rate, and
- revenue contribution.
This single view tells you which pages are earning their SEO investment and which are generating traffic without commercial output. It should inform where you allocate ongoing optimization effort.
Data As a Management Tool, Not a Marketing Deliverable
The underlying issue with how most teams use Google Analytics is that the output of their analysis is a report rather than a decision.
Good analytics practice closes the loop: You identify something in the data, you form a hypothesis about what is causing it, you make a change, and you measure the effect.
That loop requires people with the authority to act on what the data shows and the discipline to actually test hypotheses rather than just observe.
GA4 has the depth to support serious commercial analysis.
The bottleneck is rarely the tool. It is the analytical habits and organizational structures that determine whether data actually changes how teams operate or simply accumulates in dashboards that get reviewed and forgotten.
Want to Make the Most of Google Analytics?
If you want to know what your GA4 data is actually telling you about where revenue is being lost, a focused audit of your current configuration and reporting setup will surface the specific gaps worth prioritizing. Get a second opinion on what your analytics is and is not capturing.